- Mobile app development in Austin ranges from $18,000 for basic prototypes to $450,000+ for complex enterprise applications.
- Standard business apps typically require 45,000 – 95,000, depending on features and integrations.
- Austin agencies may charge 110 – 185 per hour for senior development work.
- Platform selection, backend complexity, security requirements, and team structure influence overall costs.
- React Native and Flutter can reduce duplicated development work across iOS and Android.
- Healthcare and fintech applications often require larger budgets for security and regulatory compliance.
- Discovery and clear feature prioritization help businesses control development expenses.
- Post-launch maintenance, infrastructure, and marketing should be included in the total investment.
Mobile app development cost in Austin ranges from $18,000 for a single-platform prototype to $450,000 for a regulated healthcare or fintech product.
Most Austin projects fall between $55,000 and $140,000. That spread exists for specific, predictable reasons: scope, platform strategy, team structure, and compliance requirements each push the number in a defined direction.
You control every one of those variables before a mobile app development company in Austin ever sends a quote.
This guide breaks down mobile app development cost ranges, why they vary, and the decisions that move your number up or down. Read it before your first vendor call and not after you have signed a contract.
Mobile App Development Cost in Austin: The Short Answer
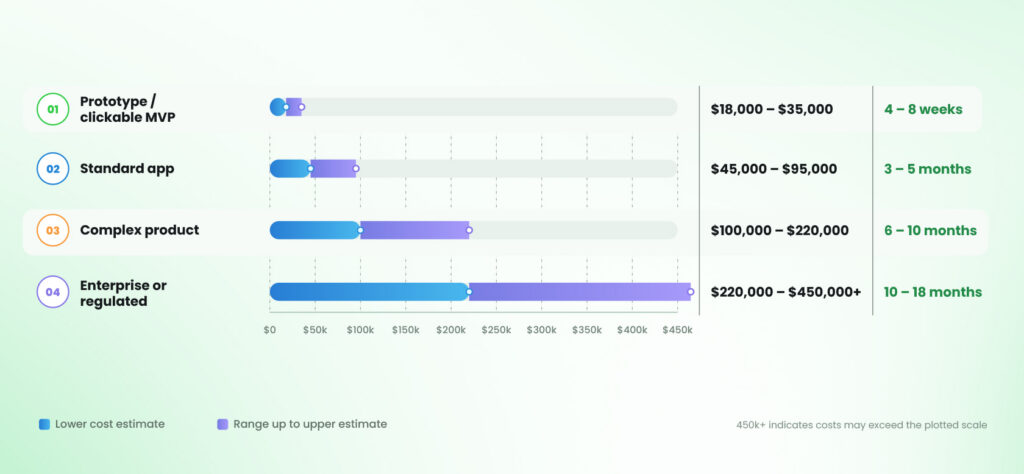
Austin app budgets cluster into four tiers. Each tier maps to a defined feature set, timeline, and team size. Place your concept into one tier before you speak with any vendor.
| Tier | Cost Range | Timeline | What It Covers |
| Prototype / clickable MVP | $18,000 – $35,000 | 4 – 8 weeks | One platform, 4–6 screens, basic auth, no custom backend |
| Standard app | $45,000 – $95,000 | 3 – 5 months | iOS and Android, custom backend, payments, push, admin panel |
| Complex product | $100,000 – $220,000 | 6 – 10 months | Real-time features, multiple integrations, role-based access |
| Enterprise or regulated | $220,000 – $450,000+ | 10 – 18 months | HIPAA or PCI scope, legacy integration, SSO, audit logging |
Hourly rates, one of the factors affecting development cost, set the floor beneath those tiers.
- Austin agencies bill $110 to $185 per hour for senior engineering work.
- Independent Austin contractors charge $75 to $140 per hour.
- Nearshore Latin American teams working Central Time charge $45 to $85 per hour.
- Offshore teams across South Asia and Eastern Europe quote $25 to $60 per hour for comparable seniority claims.
Multiply any rate by your estimated hours, and you get a build cost you can test against your budget immediately.
A 700-hour standard app costs $94,500 at $135 per hour and $42,000 at $60 per hour.
Rate arbitrage looks decisive on a spreadsheet. In practice, rework from miscommunication or thin documentation adds hidden software development costs that close most of that gap.
Why Austin App Development Costs Sit Above the National Median
Austin is not a discount market. Understanding why protects you from quotes that look suspiciously cheap, and it also protects you from vendors who price by zip code instead of by project scope.
Big Tech Compensation Resets the Local Engineering Market
Tesla, Apple, Oracle, Dell Technologies, and Samsung Austin Semiconductor all maintain substantial engineering headcount across Central Texas.
Their compensation bands pulled the regional market upward throughout the 2020s, and any Austin firm quoting far below payroll cost is cutting corners somewhere.
- Senior mobile engineer base salary in Austin metro: $155,000 – $205,000
- Equity, benefits, payroll tax, and recruiting fees add 30 – 45% on top
- Minimum blended agency rate needed to cover payroll: above $110/hour
- A local firm quoting $60/hour is likely staffing juniors or subcontracting overseas, undisclosed
Demand Density Keeps Senior Capacity Scarce
Capital Factory, the Austin Technology Council, and consistent Series A funding activity generate steady demand for product engineering. The supply of engineers who have shipped and maintained production mobile apps stays thin, and that scarcity holds rates firm.
- Engineers who have shipped and maintained production mobile apps remain in short supply
- Rates stay firm even during broader hiring slowdowns
- Premium over Dallas for engineers of equivalent seniority: 12 – 20%
Many Austin App Developers Are Not Local at All
Firms marketing themselves under that label often hold no Texas office and no Texas-based staff. They rank for the search term while delivering the work from overseas at a much lower internal cost.
- Internal delivery cost for these firms: near $28/hour
- Can still produce solid software when the vendor manages it transparently
- Price it as offshore delivery, not as a $150/hour Texas mailing address
How Austin Compares to Other US Markets
| Market | Senior Hourly Rate | Typical Standard App Build |
| San Francisco Bay Area | $170 – $275 | $120,000 – $260,000 |
| New York City | $150 – $230 | $105,000 – $215,000 |
| Seattle | $145 – $215 | $100,000 – $195,000 |
| Austin | $110 – $185 | $70,000 – $150,000 |
| Dallas–Fort Worth | $100 – $165 | $65,000 – $135,000 |
| Miami | $85 – $150 | $55,000 – $115,000 |
| Nearshore LATAM (CST overlap) | $45 – $85 | $38,000 – $85,000 |
Austin sits roughly 25 to 35 percent below the Bay Area, where San Francisco app costs run higher, and 15 to 20 percent above the national mid-market average.
That position gives you real negotiating leverage once you scope carefully before requesting quotes.
Mobile App Development Cost in Austin by Complexity Tier
Complexity drives cost more than any other single variable in an app budget. Each tier below lists its defining features and the specific decisions that keep a project inside its stated range.
Tier 1: Prototype and MVP
$18,000 to $35,000
A prototype, built through MVP development, exists to validate one hypothesis. It ships on a single platform and relies on managed services throughout, so anything that does not test the core assumption belongs in a later release.
- Four to eight screens covering one primary user flow: $9,000 – $16,000
- Email or social authentication through Firebase Auth or Supabase: $1,800 – $4,500
- Managed backend with configuration only, no custom server logic: $3,000 – $6,000
- Basic product analytics through Firebase, PostHog, or Amplitude: $1,200 – $3,000
- TestFlight distribution or a limited public App Store release: $1,000 – $2,500
How to hold the range: Pick one platform based on existing audience data rather than internal preference. Austin consumer products typically skew toward iOS app development, and field service, logistics, and workforce apps typically skew heavily toward Android. Adding the second platform at this stage costs another $12,000 to $20,000 and delays your first real user signal.
Tier 2: Standard App
$45,000 to $95,000
Most Austin businesses land in this tier. The product serves paying customers, handles sensitive data, and needs an operations layer your internal team uses every day.
- Fifteen to thirty screens across both iOS and Android: $22,000 – $40,000
- Custom backend api development with a documented REST or GraphQL API layer: $12,000 – $28,000
- Stripe payment processing plus subscription lifecycle handling: $4,500 – $15,000
- Push notifications through Firebase Cloud Messaging or OneSignal: $2,000 – $6,500
- Web-based admin panel for internal operations: $8,000 – $25,000
- Two to four third-party integrations, built through system integration api automation, such as Twilio, SendGrid, or a CRM: $5,000 – $30,000
How to hold the range: Build the admin panel as a functional internal tool rather than a designed consumer product. Austin teams routinely spend $15,000 designing a dashboard that a handful of employees open twice a day. A standard component library delivers the same operational value for $4,000 to $8,000, which protects 8 to 12 percent of a typical standard-tier budget.
Tier 3: Complex Product
$100,000 to $220,000
Complexity in this tier comes from concurrency, state management, and integration surface area rather than raw screen count. Real-time features, multi-role permissions, and offline behavior each multiply testing effort considerably.
- Real-time messaging, live tracking, or collaborative editing: $7,500 – $28,000
- Three or more distinct user roles with granular permissions: $9,000 – $22,000
- Offline-first architecture with conflict resolution on reconnect: $9,000 – $30,000
- Four to eight external integrations, including at least one legacy system: $12,000 – $60,000
- Custom analytics pipeline feeding business intelligence reporting: $8,000 – $22,000
- Automated CI/CD with staged release and rollback management: $5,000 – $14,000
How to hold the range: Sequence integrations deliberately. Ship first with the two that directly generate or protect revenue, and move everything else into a phase-two backlog funded from early operating income. Each deferred integration removes 60 to 140 hours from the pre-launch critical path, holding back $7,000 to $25,000 at Austin agency rates.
Tier 4: Enterprise and Regulated
$220,000 to $450,000+
Regulation defines this tier, not ambition. Healthcare app development, financial services, and insurance products all sit here, and compliance work adds 25 to 40 percent on top of an otherwise identical unregulated build.
- HIPAA compliant app development, PCI DSS, or SOC 2 Type II readiness across the full stack: $35,000 – $90,000
- Enterprise single sign-on through Okta, Azure AD, or SAML: $8,000 – $22,000
- Comprehensive audit logging with configurable data retention: $12,000 – $35,000
- Integration with legacy ERP, EHR, or core banking infrastructure: $25,000 – $85,000
- Third-party penetration testing and formal security assessment: $8,000 – $30,000
- Contractual SLA covering uptime, response time, and escalation: $15,000 – $45,000 annually
How to hold the range: Bring compliance counsel into discovery instead of QA, especially for fintech app development. Retrofitting audit logging into a finished codebase costs three to five times the original line item. A $12,000 requirement handled early becomes a $36,000 to $60,000 emergency when handled late, and it pushes launch back six to ten weeks while auditors review the rebuild.
A $45K App and a $220K App Can Start With the Same Idea
The difference lies in what gets built first. Identify the features and architecture that justify your investment.
Find My App’s Cost Tier!What Individual Features Cost in Austin
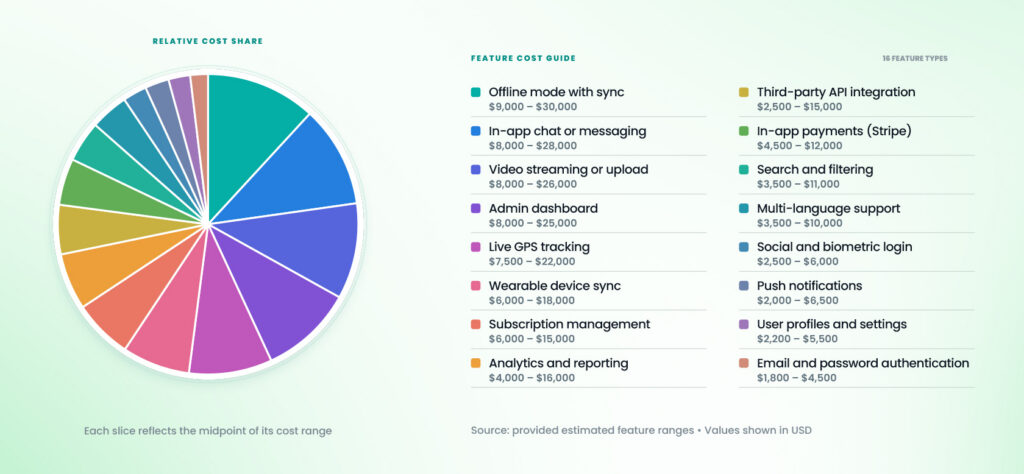
Tier ranges tell you where to place your project. Feature-level pricing tells you how to negotiate the quote you receive. Use this table to challenge inflated line items, and to price features you are still weighing.
| Feature | Cost Range | Engineering Hours | Notes |
| Email and password authentication | $1,800 – $4,500 | 15 – 35 | Managed services sit at the low end |
| Social and biometric login | $2,500 – $6,000 | 20 – 45 | Each provider adds 6 – 10 hours |
| User profiles and settings | $2,200 – $5,500 | 18 – 42 | Photo upload adds $800 – $1,600 |
| In-app payments (Stripe) | $4,500 – $12,000 | 35 – 90 | Subscriptions cost more than one-time charges |
| Subscription management | $6,000 – $15,000 | 45 – 110 | Store billing rules add real complexity |
| Push notifications | $2,000 – $6,500 | 16 – 50 | Segmented campaigns sit at the high end |
| In-app chat or messaging | $8,000 – $28,000 | 60 – 200 | Third-party SDKs cut this roughly in half |
| Live GPS tracking | $7,500 – $22,000 | 55 – 160 | Battery optimization drives the variance |
| Search and filtering | $3,500 – $11,000 | 28 – 80 | Full-text or vector search costs more |
| Offline mode with sync | $9,000 – $30,000 | 70 – 220 | Conflict resolution is the expensive part |
| Admin dashboard | $8,000 – $25,000 | 60 – 180 | Component libraries cut this substantially |
| Analytics and reporting | $4,000 – $16,000 | 32 – 115 | Custom BI dashboards sit at the top |
| Multi-language support | $3,500 – $10,000 | 28 – 72 | Right-to-left languages add 20 percent |
| Third-party API integration | $2,500 – $15,000 | 20 – 110 | Well-documented APIs cost far less |
| Video streaming or upload | $8,000 – $26,000 | 60 – 190 | Transcoding adds $200 – $900 monthly |
| Wearable device sync | $6,000 – $18,000 | 45 – 130 | Apple Health and Google Fit differ sharply |
Two patterns hold across this table.
- Features involving distributed state, including chat, offline sync, and live tracking, cost three to five times more than screen-based features.
- Third-party SDKs also beat custom builds on price in nearly every category.
Replacing a custom chat build with Stream or Sendbird saves $12,000 to $18,000 and roughly eight weeks of schedule.
The resulting subscription rarely exceeds $400 monthly at early-stage volume, totaling $14,400 across three years.
That figure sits below the one-time savings, and it excludes the maintenance burden a custom build would otherwise require.
Cost Breakdown by Development Stage
A vendor who quotes a single undifferentiated number is hiding where your money actually goes.
Demand a phase-level breakdown and compare it against the benchmarks below.
| Stage | Share of Budget | Cost on a $90,000 Build | Deliverables |
| Discovery and architecture | 8 – 12% | $7,200 – $10,800 | Requirements doc, user stories, architecture, fixed estimate |
| UI/UX design | 15 – 22% | $13,500 – $19,800 | Flows, wireframes, screens, prototype, design system |
| Frontend development | 28 – 35% | $25,200 – $31,500 | Screens, state management, offline handling, device testing |
| Backend and API | 18 – 25% | $16,200 – $22,500 | Schema, endpoints, authentication, integrations |
| QA and testing | 12 – 18% | $10,800 – $16,200 | Test plans, device matrix, regression suites, bug fixes |
| Project management | 8 – 12% | $7,200 – $10,800 | Sprint planning, reporting, risk tracking, releases |
| Launch and store submission | 2 – 4% | $1,800 – $3,600 | Store listings, ASO metadata, production deployment |
Discovery Converts an Idea Into a Fixed Price
A discovery sprint costs $6,000 to $18,000 in Austin. It produces a specification your engineers can build against directly, rather than a guess that shifts once real work begins.
- Cost range: $6,000 – $18,000
- Skip it, and most vendors revise the estimate upward mid-project by 20–35%.
- Fund it properly, and you get a fixed price you can hold the vendor to contractually
- Protection on a $90,000 build: $18,000 – $31,000 in avoided overrun
Design Carries the Most Common Budgeting Error
Buyers cut UI/UX design first because it produces no working software. A $16,000 line item looks optional next to $28,000 of engineering, but that instinct costs more than nearly any other budgeting decision in this guide.
- A design system built once reduces frontend hours by 15 – 25% on every feature added afterward
- Efficiency returned on a $90,000 build: $7,000 – $12,000, before you ship a single update
- The savings compound with each new screen or feature added post-launch
QA Looks Like Overhead Until Launch Week
A twelve- to eighteen-percent QA allocation, guided by mobile app testing strategies, costs $10,800 to $16,200 on a standard Austin build. Cutting it to five percent feels responsible in the moment, but the savings rarely survive contact with real users.
- Upfront saving from cutting QA to 5%: roughly $9,000
- A production bug in your payment flow costs far more in refunds, support hours, and one-star reviews
- Emergency fixes bill at $180 – $250/hour, above the rate in your original contract
Cost by Platform and Technology Stack
Your platform decision moves the total by tens of thousands of dollars in either direction. Make the call using your own user data rather than a vendor’s stack preference.
| Approach | Cost Range | Timeline | Best Fit |
| Native iOS only (Swift, SwiftUI) | $35,000 – $110,000 | 3 – 6 months | Consumer apps, premium UX, heavy device API use |
| Native Android only (Kotlin) | $35,000 – $110,000 | 3 – 6 months | Field workforce, logistics, international markets |
| Native on both platforms | $70,000 – $220,000 | 5 – 9 months | Performance-critical products, ARKit, sensor work |
| React Native (single codebase) | $42,000 – $130,000 | 3 – 6 months | Most B2B and consumer apps needing both platforms |
| Flutter (single codebase) | $45,000 – $135,000 | 3 – 6 months | Design-heavy products wanting identical rendering |
| Progressive Web App | $18,000 – $55,000 | 6 – 14 weeks | Content, booking, and directory products |
The decision rule that saves the most money: Default to cross-platform development unless a specific technical requirement forbids it.
Flutter app development and React Native each save 30 to 40 percent against building two separate native applications.
On a standard two-platform build, that difference translates to $28,000 to $88,000. Instagram, Shopify, and Discord all run React Native in production at scale.
Native development, compared in native vs cross-platform development guides, becomes the right call under three conditions: heavy ARKit or Bluetooth LE dependence, frame-rate-sensitive animation, or a roadmap that needs day-one platform features.
Outside those cases, native development spends $28,000 to $88,000 on capabilities most products never use.
Backend Choices Carry Their Own Range
| Backend Approach | Build Cost | Monthly Operating Cost | Trade-off |
| Firebase or Supabase (managed) | $6,000 – $18,000 | $25 – $400 | Fast to build, harder to migrate later |
| Node.js or Python on AWS/GCP | $18,000 – $55,000 | $150 – $1,200 | Full control, higher DevOps overhead |
| Headless CMS plus API layer | $12,000 – $30,000 | $80 – $600 | Strong for content, weak for transactions |
| Custom microservices | $55,000 – $150,000 | $800 – $4,000 | Justified above 100,000 monthly users |
Start with managed infrastructure and migrate only when traffic or compliance forces the change.
Migrating later costs $20,000 to $45,000, and that figure still lands below the price of overbuilding upfront.
Austin startups regularly commit $55,000 to infrastructure supporting a user base they never acquire, capital that would otherwise fund roughly eight additional months of runway.
Cost by Engagement Model: What Austin Buyers Actually Choose
Team structure, the heart of the in-house vs development partner decision, affects total cost of ownership more than your headline hourly rate. Compare every option on twelve-month cost, not on the number at the top of the proposal.
| Model | Effective Rate | 12-Month Cost | Strengths | Risks |
| In-house Austin team (2 devs + designer) | $95 – $130/hr loaded | $420,000 – $580,000 | Full control, retained knowledge | Hiring takes 4–7 months |
| Austin agency | $110 – $185/hr | $85,000 – $165,000 | Local accountability, CST alignment | Highest per-hour cost |
| Austin independent contractor | $75 – $140/hr | $55,000 – $110,000 | Direct communication, low overhead | No design or QA coverage |
| Nearshore LATAM agency | $45 – $85/hr | $45,000 – $95,000 | CST overlap, senior staffing | Needs written specification |
| Offshore agency | $25 – $60/hr | $30,000 – $70,000 | Lowest quoted cost | 9–11-hour gap, rework exposure |
| Hybrid (local lead + offshore pod) | $55 – $95/hr blended | $50,000 – $105,000 | Balances cost and oversight | Adds coordination overhead |
Where Offshore Savings Actually Disappear
The hourly rate is rarely the problem. Rework is, and it starts when a requirement misread across a ten-hour time gap surfaces two sprints later, turning a $9,000 payment flow into a $22,000 line item.
- Rebuilt features consume 140 – 180% of the original estimate
- Three controls prevent this, and each costs almost nothing to implement upfront:
- Require an approved written specification before any coding begins
- Insist on daily written standups with build links attached
- Tie every payment to a demonstrated, testable milestone
- Apply all three, and offshore delivery holds at $30,000 – $70,000, as advertised
- Skip them, and you risk the $85,000 rebuild some Austin founders paid eighteen months after launch
The Hybrid Model Deserves More Attention Than It Gets
Hire one senior product lead in Austin, and pair them with a vetted nearshore or offshore engineering pod. The lead owns requirements, reviews every pull request, and represents your interests technically.
- Product lead cost: $9,000 – $14,000 monthly
- Engineering pod rate: $45 – $60 per hour
- Annual cost for the lead: $108,000 – $168,000
- Annual cost for the build: $45,000 – $95,000
- Captures roughly 70% of available offshore savings while cutting most communication risk
- Preferred by Austin operators on their second or third product build over first-timers
Industry-Specific Cost Premiums in the Austin Market
Austin’s economy concentrates in a handful of sectors, and each carries a distinct compliance and integration load.
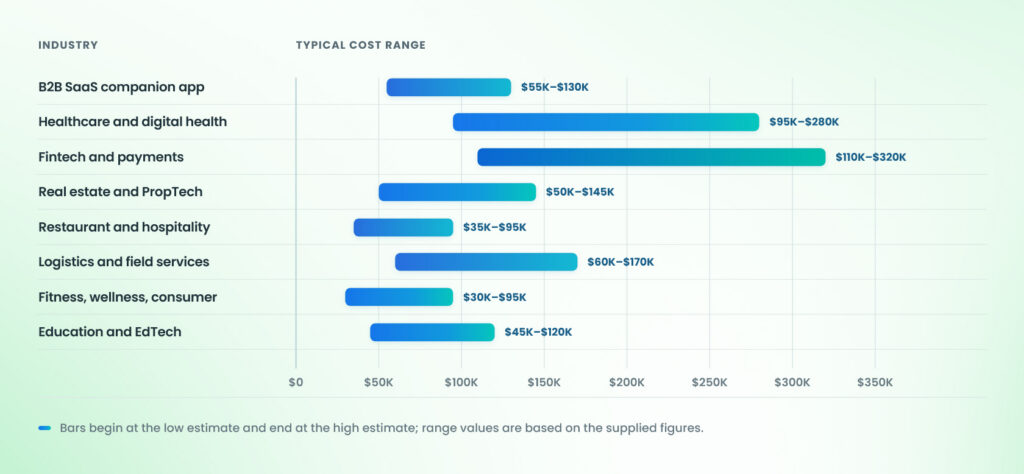
Price your project against your vertical rather than a generic citywide average.
| Vertical | Typical Range | Premium Driver | Compliance Load |
| B2B SaaS companion app | $55,000 – $130,000 | Multi-tenancy, SSO, permissions | SOC 2 Type II |
| Healthcare and digital health | $95,000 – $280,000 | PHI handling, EHR integration, BAAs | HIPAA, HITECH |
| Fintech and payments | $110,000 – $320,000 | KYC, ledger accuracy, fraud controls | PCI DSS, state MTL |
| Real estate and PropTech | $50,000 – $145,000 | MLS/IDX feeds, document workflows | TREC rules, e-signature |
| Restaurant and hospitality | $35,000 – $95,000 | POS integration, live order state | PCI SAQ-A |
| Logistics and field services | $60,000 – $170,000 | Offline mode, GPS, route optimization | DOT where applicable |
| Fitness, wellness, consumer | $30,000 – $95,000 | Wearable sync, subscription billing | Store subscription rules |
| Education and EdTech | $45,000 – $120,000 | Content delivery, progress tracking | FERPA, COPPA |
Texas-specific requirements Austin buyers overlook
The Texas Data Privacy and Security Act took effect on July 1, 2024, and it applies to businesses operating in Texas that process consumer personal data above the thresholds set in the statute.
Compliance adds roughly $6,000 to $18,000, covering consent management, a data deletion workflow, a privacy notice, and opt-out handling.
Build all four during discovery. Adding them after App Store review costs $14,000 to $30,000 and delays launch by four weeks.
Hidden and Recurring Costs Most Austin Budgets Miss
Your build cost and your project cost are two different numbers, separated by roughly a year. Plan against a full twelve-month operating figure, including mobile app marketing cost, instead of a one-time development estimate.
| Cost Category | Amount | Frequency |
| Apple Developer Program | $99 | Annual |
| Google Play Developer account | $25 | One-time |
| Cloud hosting and database | $80 – $1,400 | Monthly |
| Third-party APIs (maps, SMS, email, auth) | $150 – $900 | Monthly |
| Payment processing | 2.9% + $0.30 | Per transaction |
| App store commission | 15 – 30% of in-app revenue | Per transaction |
| Crash reporting and monitoring | $50 – $300 | Monthly |
| Maintenance and OS updates | 15 – 20% of build cost | Annual |
| Security patching and dependencies | $2,500 – $9,000 | Annual |
| Penetration testing (regulated apps) | $8,000 – $30,000 | Annual |
| User acquisition and ASO | $2,500 – $35,000 | Monthly |
| Customer support tooling | $100 – $700 | Monthly |
Build a Twelve-Month View Before You Sign
Take a $90,000 standard app and work the operating costs forward across the first year.
Hosting, third-party APIs, and monitoring run roughly $600 monthly, or $7,200 annually. Mobile app maintenance cost at seventeen percent add another $15,300.
Modest user acquisition and app store optimization at $4,000 monthly add $48,000 more. Your realistic year-one figure reaches roughly $160,000, not the $90,000 on the development contract.
Founders who budget only the build predictably run out of money about three months after launch, precisely when usage data starts telling them which features deserve further investment.
The Seven Cost Drivers You Control
Every driver below has a corresponding lever you can pull before development starts. Pull the right ones, and you reduce total cost without damaging the product you ship.
| Driver | Cost Impact | Your Control Lever |
| Undefined scope | +30 – 60% overrun | Fund a paid discovery sprint before fixed quotes |
| Feature count at launch | $3,000 – $12,000 per feature | Rank by revenue impact, ship the top third |
| Custom design depth | +$8,000 – $30,000 | Adopt Material 3 baselines, customize selectively |
| Integration surface | $2,500 – $15,000 each | Sequence integrations across two releases |
| Platform strategy | +$25,000 – $80,000 | Default to React Native or Flutter |
| Compliance requirements | +25 – 40% of build | Involve counsel during discovery, not QA |
| Change requests mid-build | $1,500 – $8,000 each | Freeze scope per sprint, batch into phase two |
Scope Discipline Returns More Than Any Other Tactic
Rank every proposed feature against one question: does removing this feature stop a user from completing the core action your product exists to serve?
A typical Austin feature list arrives with 24 to 35 items. A disciplined version one contains 8 to 12.
That reduction moves a $130,000 quote down to roughly $75,000 and shortens time to real user feedback by four months.
Change Requests Deserve a Formal Process
Mid-sprint changes cost 40 to 90 percent more than the same change scoped upfront, because engineers unwind completed work and QA reruns every affected regression suite.
Establish a written change protocol before development starts, then batch incoming requests into a backlog reviewed at each sprint boundary.
Teams running this process typically absorb three to five changes across a project instead of fifteen to twenty-five.
At $1,500 to $8,000 per change, the discipline protects $15,000 to $160,000, depending on scope.
How to Scope Your App Before Requesting Quotes
Accurate quotes require accurate inputs. A vendor working from a vague brief protects itself with a forty percent range, which makes comparing offers nearly impossible.
Answer these seven questions first:
- What single action does your app exist to make easier? Unclear answers add $8,000 to $20,000 in discovery rework.
- Who performs that action, and how often? Daily-use products need architecture costing 20 to 35 percent more than monthly-use products.
- Which features genuinely belong in version one? Each deferred feature saves $3,000 to $12,000.
- Which platforms do you need at launch? Dropping one platform saves $25,000 to $80,000.
- Do you need a custom backend at this stage? Managed services save $12,000 to $37,000.
- Which integrations are non-negotiable? Name specific systems rather than categories; vague answers add $2,500 to $15,000 each.
- What does success look like ninety days after launch? Undefined metrics reliably produce $15,000 to $40,000 in feature bloat.
Produce these four artifacts before your first call:
- A one-page product brief covering the problem, the user, and the primary action
- A prioritized feature list split into version one and version two, with an owner named for each item
- A rough user flow showing every screen between opening the app and completing the action
- A constraint list covering budget ceiling, hard launch deadline, and known compliance obligations
Hand identical artifacts to every vendor you approach. Quotes will describe the same product, and variance typically drops from around 200 percent to about 30 percent across your shortlist.
Producing these documents takes six to ten hours of your own time, and that investment routinely removes $15,000 to $35,000 of defensive padding from the estimates you receive.
When You Should Pay for Discovery
Fund a paid discovery engagement whenever your product touches money, regulated data, or an existing system of record.
Discovery costs $6,000 to $18,000 in Austin and produces both a fixed price and a buildable architecture.
Quotes issued without discovery carry 20 to 35 percent padding, since vendors price the uncertainty they cannot see. On a $120,000 project, that padding costs $24,000 to $42,000.
Your App Quote Is Only as Accurate as Your Project Scope
Get your features, technical dependencies, and delivery expectations defined before development proposals turn into competing assumptions.
Define My Project Scope!How to Read and Compare Vendor Quotes
Three quotes at $48,000, $92,000, and $170,000 rarely represent three prices for one product.
They almost always represent three different products built to three different standards.
Require Line-Item Itemization
Ask every vendor for hours and cost broken out by phase, role, and feature. A vendor who refuses is either guessing at the number or hiding a subcontracting arrangement.
| Quote Signal | What It Usually Means | Cost Exposure |
| No design line item | Developers will produce the screens | $12,000 – $25,000 in later redesign |
| QA under 10% of total | Testing compressed into development | $8,000 – $30,000 in post-launch fixes |
| No project management line | Coordination absent or buried | $10,000 – $20,000 in overrun |
| Single lump sum, no phases | Work was never decomposed | 30 – 60% overrun risk |
| Quote arrives within one hour | No engineering review occurred | Estimate unreliable by 50%+ |
| Rate below $35/hr, US-facing | Junior staffing or subcontracting | 140 – 180% rebuild cost |
Verify These Five Items Before Signing
- Code ownership. Assign full IP and repository access at each milestone. Recovering code later costs $10,000 to $40,000 in legal and rebuild work.
- Named team members. Request resumes and confirm assignment duration. Substitution mid-project adds 60 to 120 hours of ramp-up you pay for.
- Milestone payments. Tie every payment to a demonstrated build, capping exposure at one milestone worth $8,000 to $25,000.
- Post-launch warranty. Thirty to ninety days of free bug fixing is standard across Austin agencies, worth $4,000 to $12,000.
- Exit terms. Define exactly what you receive if the engagement ends early: source code, credentials, documentation, and deployment access.
The cheapest quote on your desk is rarely the cheapest project.
A $48,000 proposal that omits design, QA, and project management is not cheaper than a complete $92,000 one.
It is incomplete by roughly $38,000 of work someone eventually has to perform, and you pay that difference later at emergency rates of $180 to $250 per hour.
Timeline and Cost Move Together
Compressing a schedule rarely saves money.
Adding engineers to an already-late project increases cost while often delivering more slowly, a pattern well documented in software project economics.
| Timeline | Cost Effect | Dollar Impact on $90,000 | When It Applies |
| Standard pace (3–6 months) | Baseline | $90,000 | Most Austin projects |
| Accelerated (25% faster) | +18 – 30% | $106,000 – $117,000 | Funding milestone, launch window |
| Extended (50% longer) | +10 – 20% | $99,000 – $108,000 | Part-time team, added coordination |
| Phased releases | −15 – 25% on v1 | $67,500 – $76,500 | Nearly always the better structure |
Phasing beats acceleration on both cost and risk in nearly every Austin project.
Ship a narrow version one within twelve weeks, gather usage data, then fund version two from evidence rather than assumption.
Operators who phase consistently spend 20 to 30 percent less across eighteen months than those who launch everything at once.
Your First 90 Days After Launch: What to Budget
Launch day starts your spending; it does not end it. Austin teams who plan the first quarter properly convert early users instead of losing them to bugs and silence.
App Store Submission Carries Real Cost
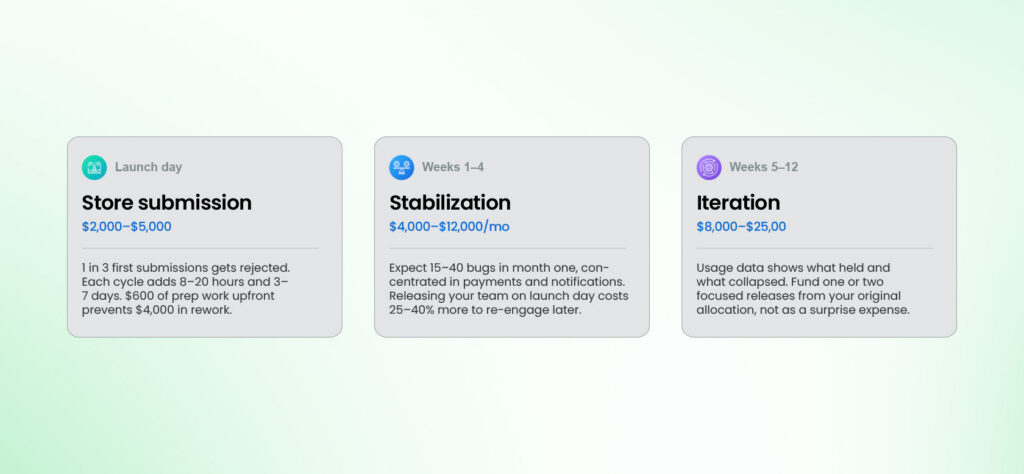
Apple rejects roughly one in three first submissions, usually for predictable reasons that guides to publish and update apps explain. Incomplete privacy disclosures, unclear subscription terms, and missing reviewer credentials account for most of them.
- Each rejection cycle consumes 8 – 20 engineering hours and adds 3 – 7 days to your app developmnet timeline.
- Budget for submission work and typical revisions: $2,000 – $5,000
- Prepare your privacy nutrition label, demo account, and support URL before you submit
- That prep costs about $600 in engineering time and reliably prevents $4,000 in avoidable rework
Weeks One Through Four: Stabilization
Real devices in real hands expose behavior no test matrix fully anticipates. Expect a cluster of bugs in the first month, concentrated in payments, notifications, and older device performance.
- Expected bug count in month one: 15 – 40
- Retain your development team part-time through this window: $4,000 – $12,000 monthly
- Teams that release engineer that launch day pay re-engagement rates 25 – 40% higher two weeks later
Weeks Five Through Twelve: Iteration
Usage data now shows which product assumptions held and which collapsed. Plan one or two focused releases addressing the specific drop-off points your analytics surface.
- Budget for this iteration cycle: $8,000 – $25,000
- Fund it from your original project allocation, not as a surprise expense
- Well-funded Austin products stall around three months post-launch when iteration isn’t budgeted upfront
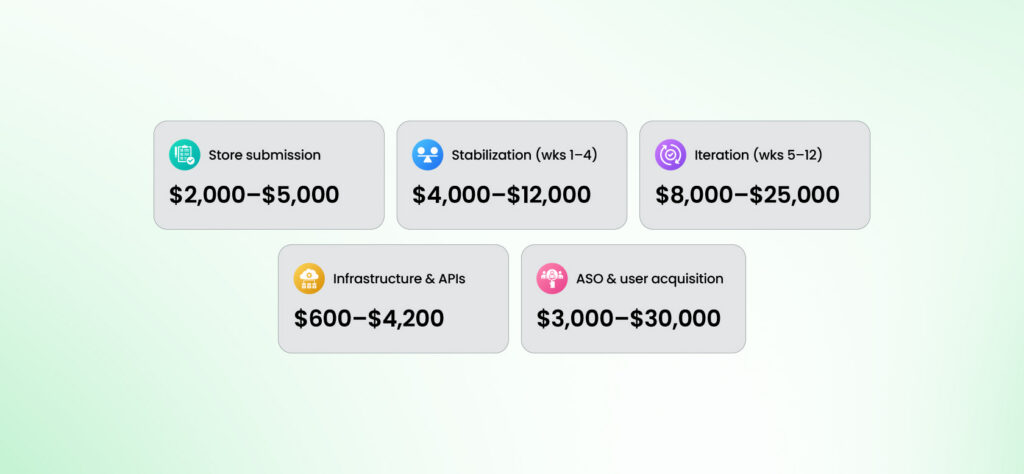
| First 90 Days | Budget Range |
| Store submission and revisions | $2,000 – $5,000 |
| Stabilization retainer (weeks 1–4) | $4,000 – $12,000 |
| Iteration releases (weeks 5–12) | $8,000 – $25,000 |
| Infrastructure and third-party services | $600 – $4,200 |
| ASO and initial user acquisition | $3,000 – $30,000 |
Six Ways to Reduce Cost Without Reducing Quality
Every tactic below reduces mobile app development cost while preserving product quality, which is why cutting QA, skipping design, and hiring the lowest bidder don’t appear on this list.
- Ship a genuine MVP. Limit version one to the single flow that proves demand exists, and track MVP development cost against it. Expect 35 to 55 percent savings, or $31,000 to $50,000, against a $90,000 full-scope build.
- Choose one codebase. React Native app development or Flutter delivers both platforms from a single team. Expect 30 to 40 percent savings, worth $28,000 to $88,000 against dual native development.
- Use managed backend services. Firebase and Supabase eliminate weeks of infrastructure and DevOps work. Expect $12,000 to $37,000 in savings on a standard two-platform build.
- Adopt a design system early. A single system halves per-screen design time after roughly the first eight screens, saving $6,000 to $15,000 across a standard-tier project.
- Integrate rather than build. Stripe, Clerk, Twilio, and Mapbox each replace 80 to 250 hours of engineering work. Every swap saves $9,000 to $30,000 at Austin agency rates.
- Structure a hybrid team. Pair one local product lead with a vetted nearshore engineering pod on a fixed scope for 35 to 50 percent savings against a fully local Austin build.
Choosing an Austin App Development Partner
The team you select affects your final cost more than any other decision you make. Evaluate every candidate on verifiable evidence rather than the quality of their sales presentation.
Ask These Questions on Your First Call Before Hiring A Mobile App Development Partner:
- Which apps have you shipped that are live in the stores today, and what are the links?
- Who specifically will work on my project, at what internal rate, and where do they sit?
- What does your discovery process produce, what does it cost, and is the resulting price fixed?
- How do you price a requirement that turns out more complex than the original estimate?
- What happens to my code, credentials, and documentation if we end the engagement early?
- Which of my requested features would you advise cutting, and what does each cut save?
That final question separates order-takers from genuine partners faster than anything else on this list. A vendor who recommends full custom development for every request is selling hours rather than outcomes.
Signals Worth Weighting:
- Live, checkable store listings carry more weight than a polished case study PDF with no verifiable links.
- A named senior contact who stays engaged past the sales call prevents $8,000 to $20,000 in handoff losses.
- Written scope documents produced before quoting cut overrun risk from around 45 percent to under 15 percent.
- Verifiable client references you can call directly about budget adherence and change handling.
- Transparent seniority and internal rate disclosed for every engineer assigned to your project.
- Third-party reviews on Clutch or G2 that carry named reviewers rather than anonymous initials.
Final Thoughts
Mobile app development cost in Austin follows rules, not luck, and every rule works in your favor once you know it. Scope defines your tier, platform strategy defines your multiplier, and team structure defines your first-year total. Therefore, the right mobile app development company in Austin will explain each of these drivers before it sends you a number.
Define version one narrowly, fund discovery before you request fixed quotes, and compare each custom mobile app development company on itemized phases rather than headline totals. Budget across twelve months of operation instead of a single development invoice. Austin gives you senior engineering without coastal pricing, so use that advantage deliberately and put the difference toward iteration.
Get a Fixed Mobile App Development Cost for Your Austin Project
Send us your product brief and prioritized feature list. We will place your concept in one of the four tiers above and return an itemized cost by phase, a named list of features worth cutting, and the savings attached to each.
Get My Itemized App Quote!Frequently Asked Questions
Mobile app development in Austin costs $18,000 to $35,000 for a prototype and $45,000 to $95,000 for a standard two-platform app. Complex products run $100,000 to $220,000, and regulated healthcare or fintech builds reach $220,000 to $450,000. Austin agencies bill $110 to $185 per hour for senior engineering work.
Austin agencies charge $110 to $185 per hour, and independent Austin contractors charge $75 to $140. Nearshore teams working Central Time charge $45 to $85, and offshore teams charge $25 to $60. Rates below $35 per hour usually indicate junior staffing or undisclosed subcontracting.
Neither Android app development nor iOS builds cost meaningfully less natively; both run $35,000 to $110,000 for comparable scope. Check your existing web analytics to find your real audience split before deciding. If budget binds, React Native or Flutter serves both platforms for 30 to 40 percent less.
A prototype ships in four to eight weeks at $18,000 to $35,000. A standard two-platform app takes three to five months at $45,000 to $95,000. Complex products take six to ten months, and regulated products take ten to eighteen months because compliance review adds calendar time.
Budget 15 to 20 percent of your initial build cost annually, which equals $13,500 to $18,000 on a $90,000 app. Maintenance covers operating system updates, security patches, dependency upgrades, and ongoing bug fixes. Regulated apps require an additional $8,000 to $30,000 annually for penetration testing and audit support.
Choose an Austin agency at $85,000 to $165,000 annually when your project involves regulated data or a hard external deadline. Choose offshore delivery at $30,000 to $70,000 when your requirements are documented and fixed. The hybrid model captures most of the savings while preserving technical oversight.
Underestimating scope causes more overruns than every other factor combined. Most overruns trace directly back to requirements nobody defined before development began. A paid discovery sprint costing $6,000 to $18,000 prevents overruns that routinely reach $27,000 to $54,000 on a $90,000 build.
Firebase or Supabase handles most applications operating below roughly 100,000 monthly active users without difficulty. Managed services cost $6,000 to $18,000 to configure, versus $18,000 to $55,000 for custom infrastructure. Migrate later at $20,000 to $45,000 once compliance requirements or genuine scale force the change.
Compare each quote against your feature list, not against the other quotes on your desk. Verify that design sits at 15 to 22 percent, QA at 12 to 18 percent, and project management at 8 to 12 percent. A quote missing those line items is incomplete and not competitive.